Case study · eCommerce analytics SaaS · India
EcommPulse: one analytics dashboard for sellers across marketplaces
How I built EcommPulse's React dashboards: sales, fees, refunds and regional performance across Amazon, Flipkart and Shopify, in one place.
- Client
- EcommPulse
- Industry
- eCommerce analytics SaaS
- Location
- India
- My role
- Frontend engineer: dashboards and data views
- Engagement
- Software Engineer at Unico Connect, 2021–2023
Outcomes
75%
less manual operations work for sellers
50%
faster data-to-insight pipeline
30%
fewer stockouts across brands
Context
The problem
01.
Sellers' data was split across marketplaces, each with its own reports, fees and formats.
02.
Restock decisions came late, so stockouts were common, and prices were rarely revisited.
03.
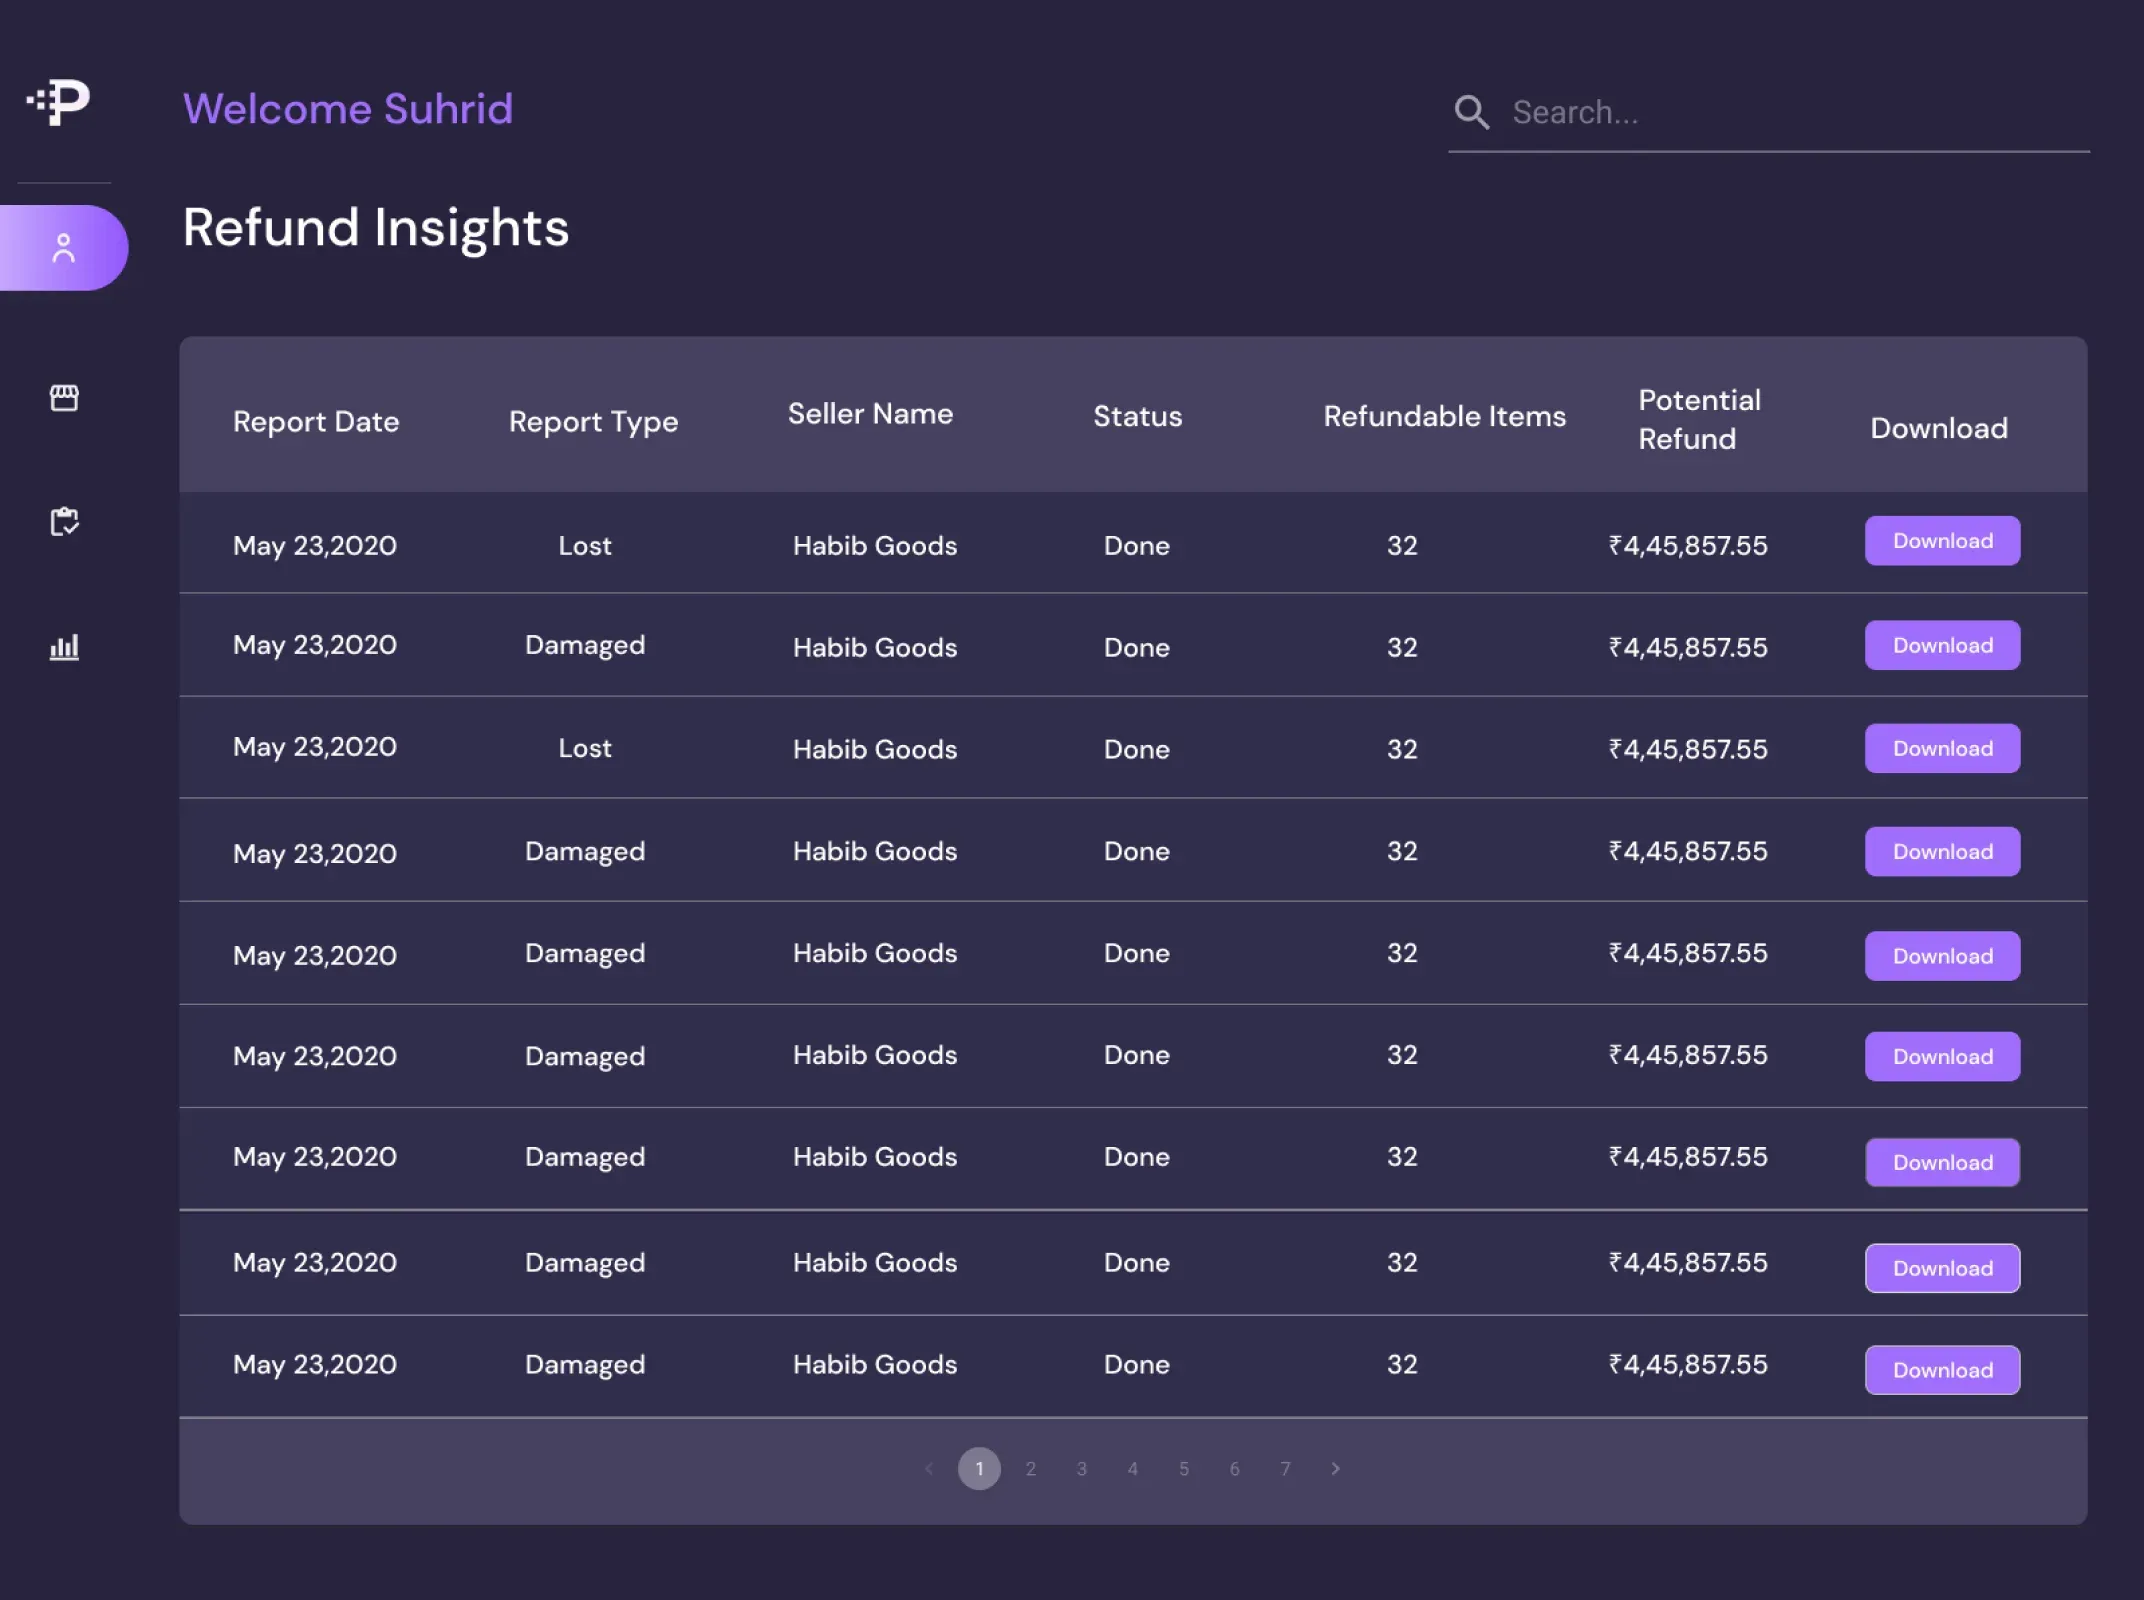
Payouts were reconciled only at quarter-end, and a single brand can generate hundreds of thousands of transactions a month.
Approach
Platform decisions
01
Normalize, don't flatten
Each marketplace's source-level detail is kept behind one unified view, so a new marketplace can be added without re-architecting.
02
Explainable numbers over black boxes
Forecasts and pricing suggestions come with their supporting figures, so sellers can see why.
03
Grounded natural-language answers
QueryAI maps plain-English questions to queries on the data model instead of generating free-form answers.
My work
What I built
Software Engineer at Unico Connect, 2021–2023
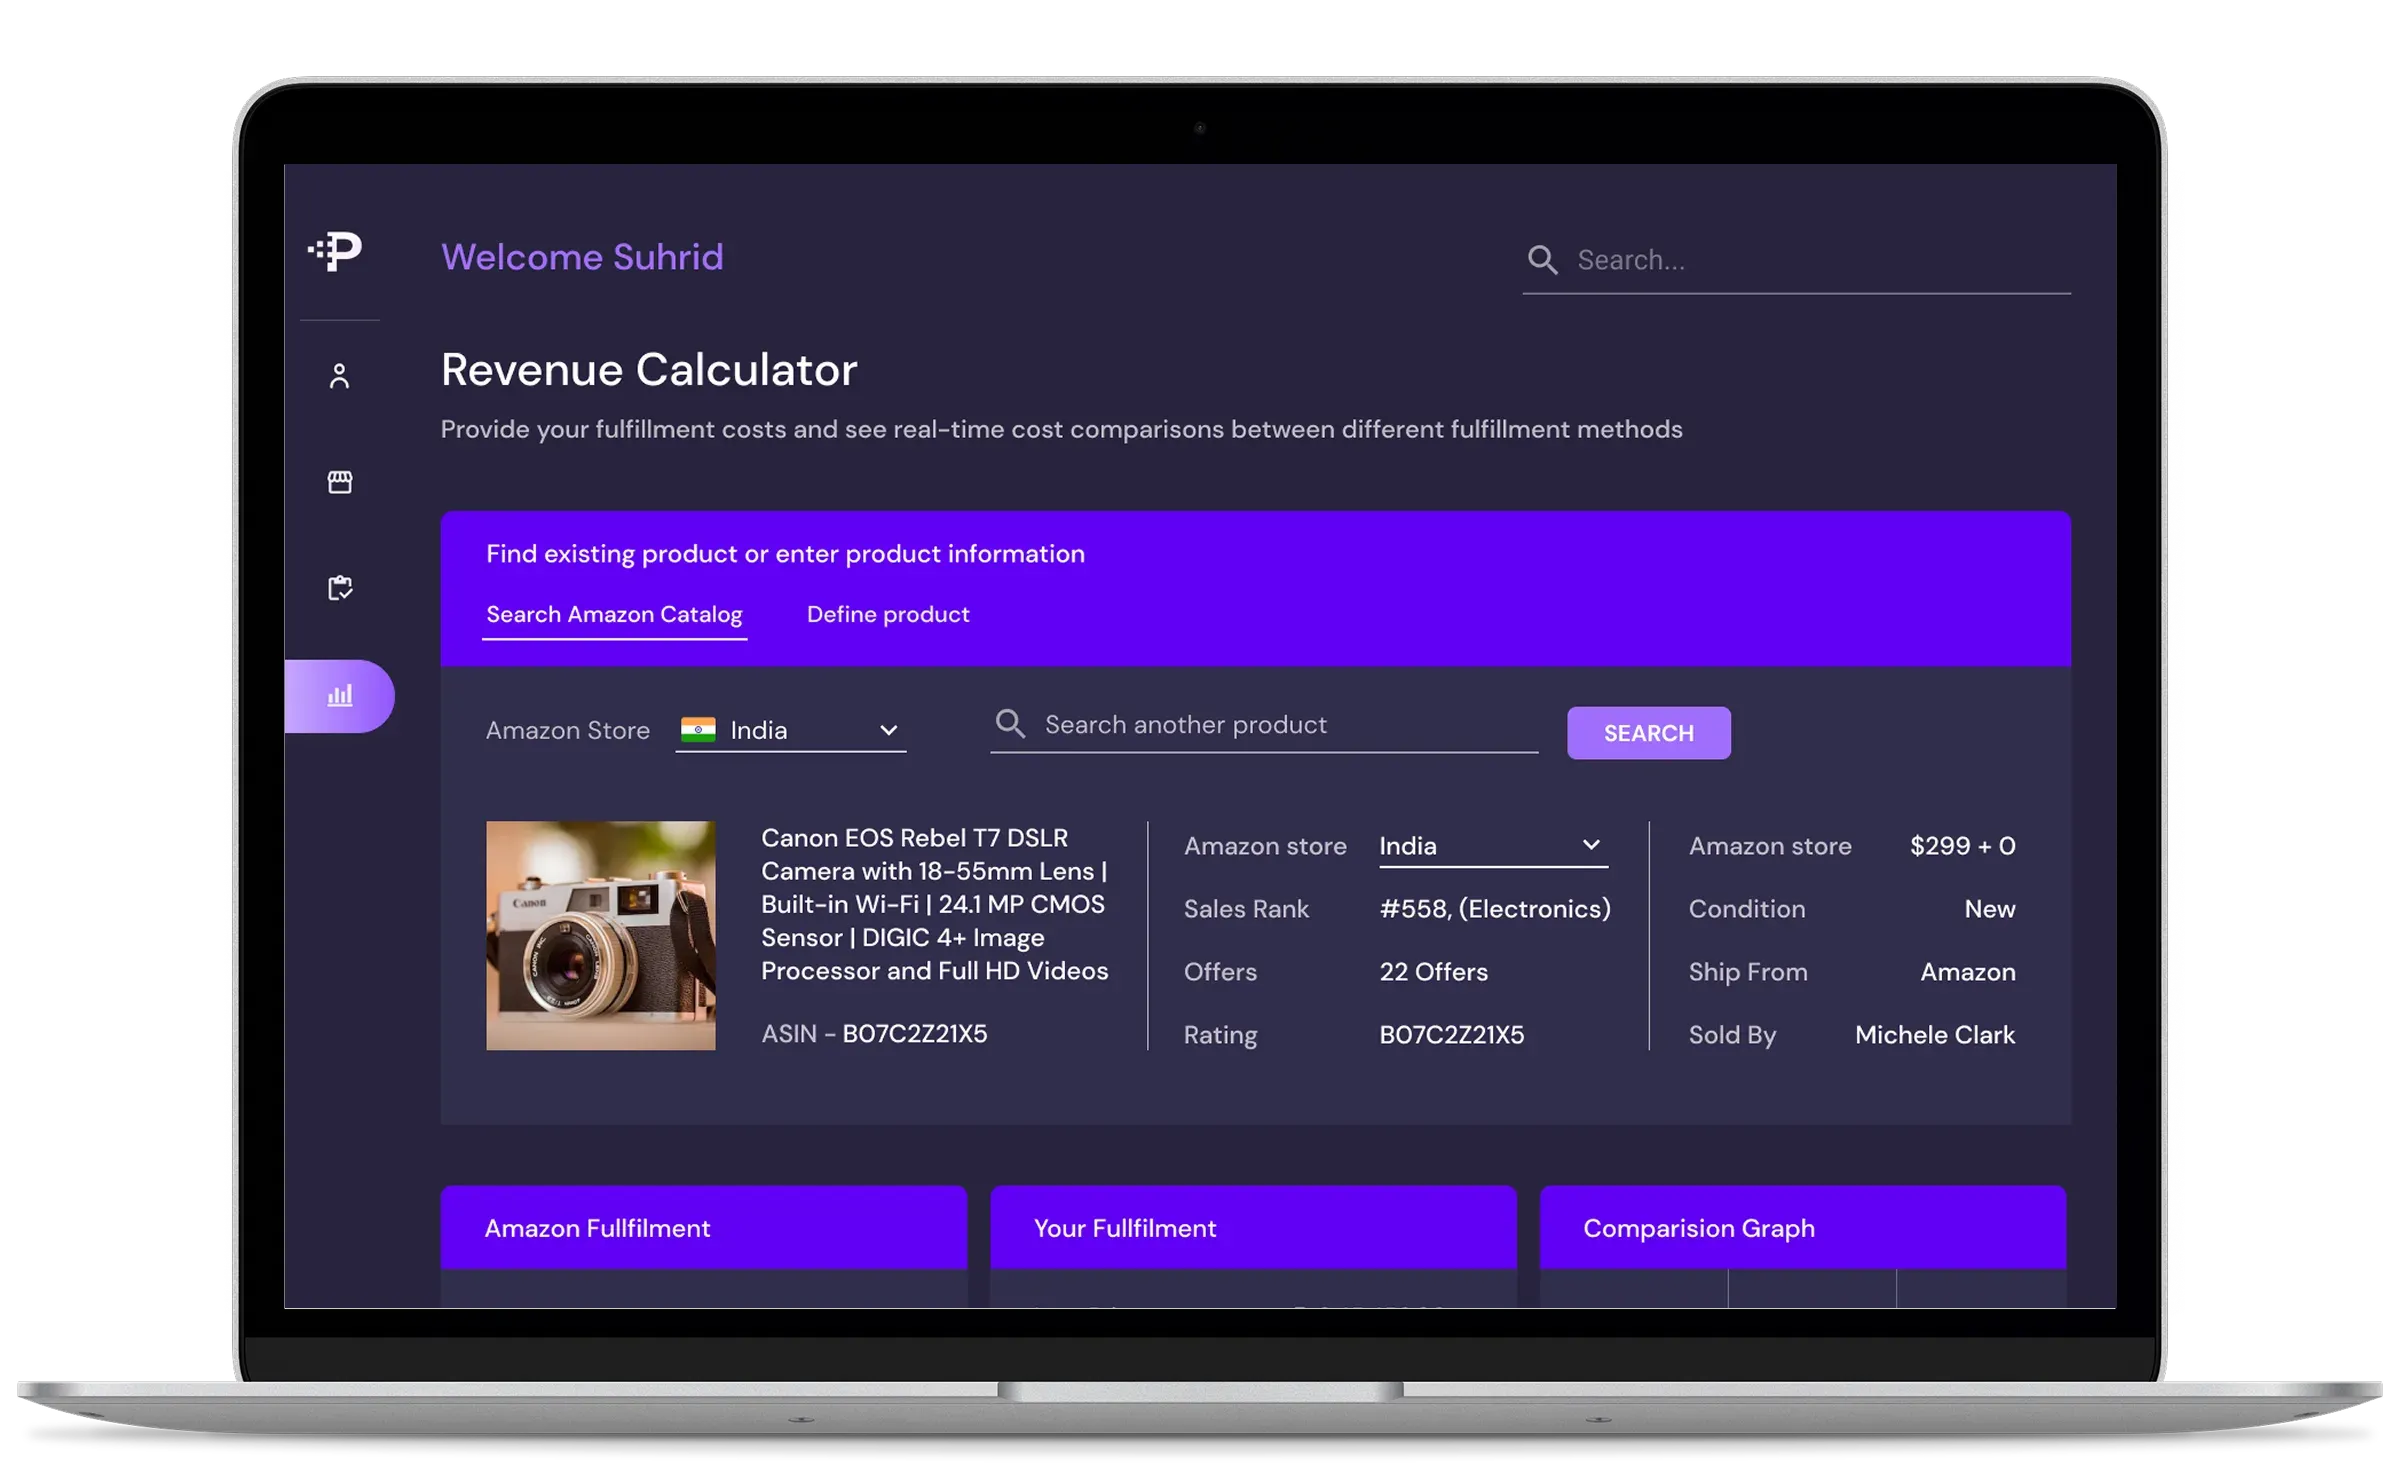
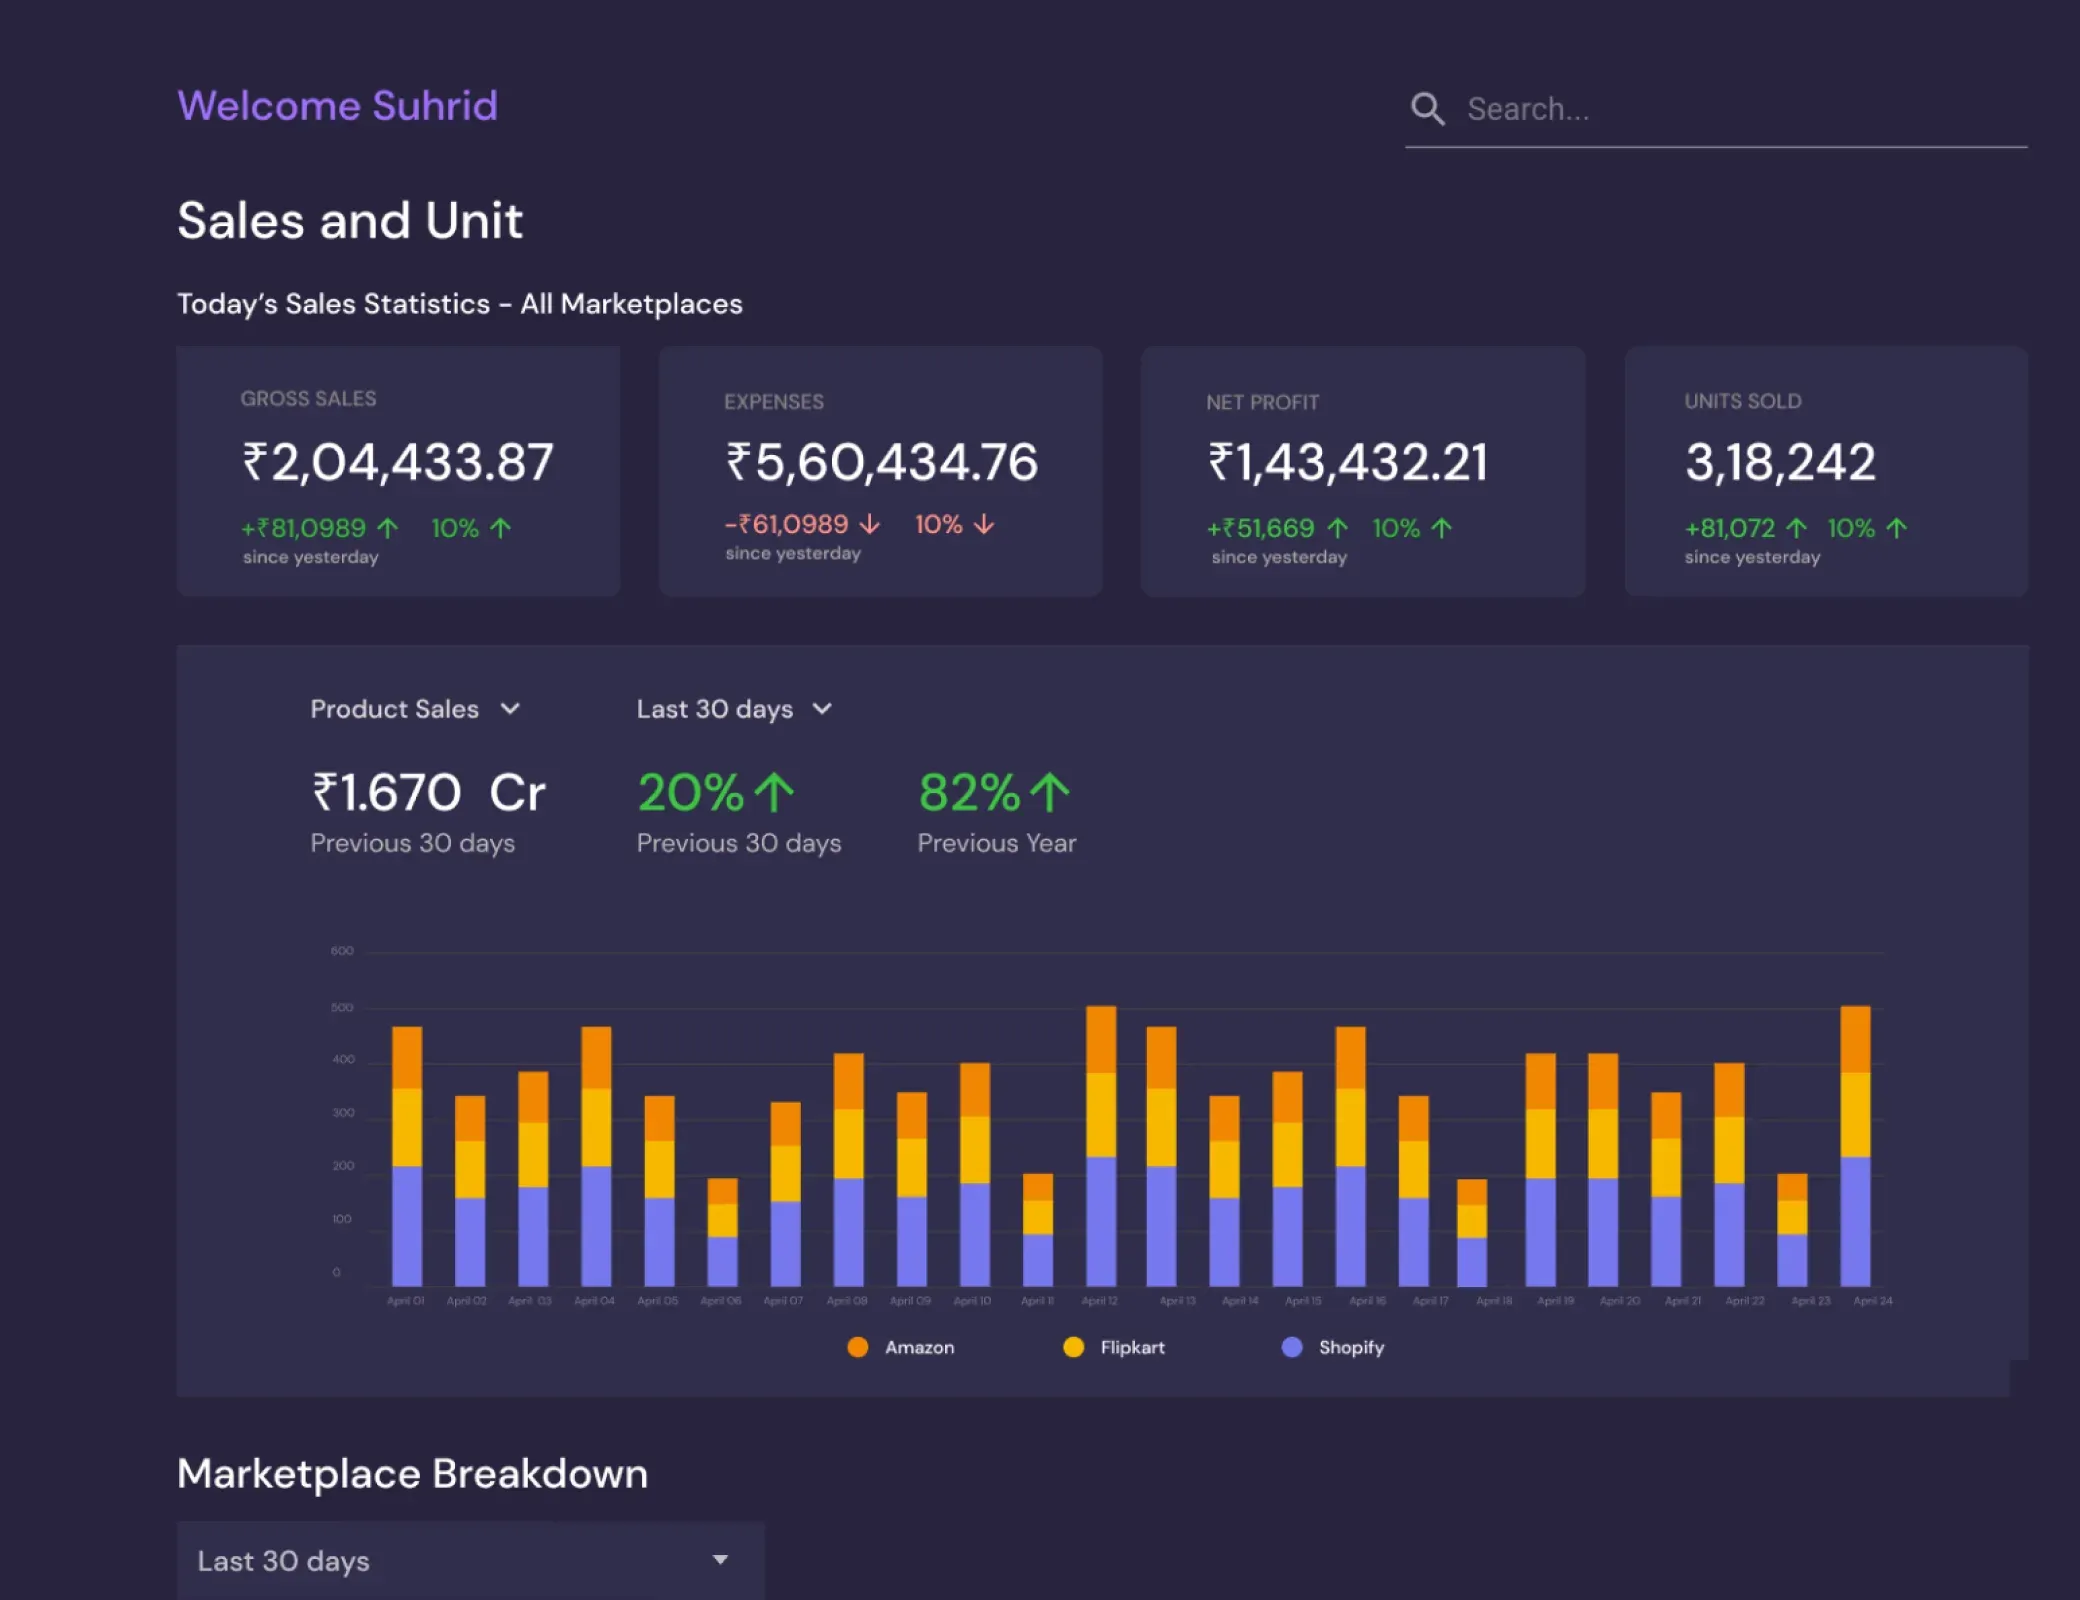
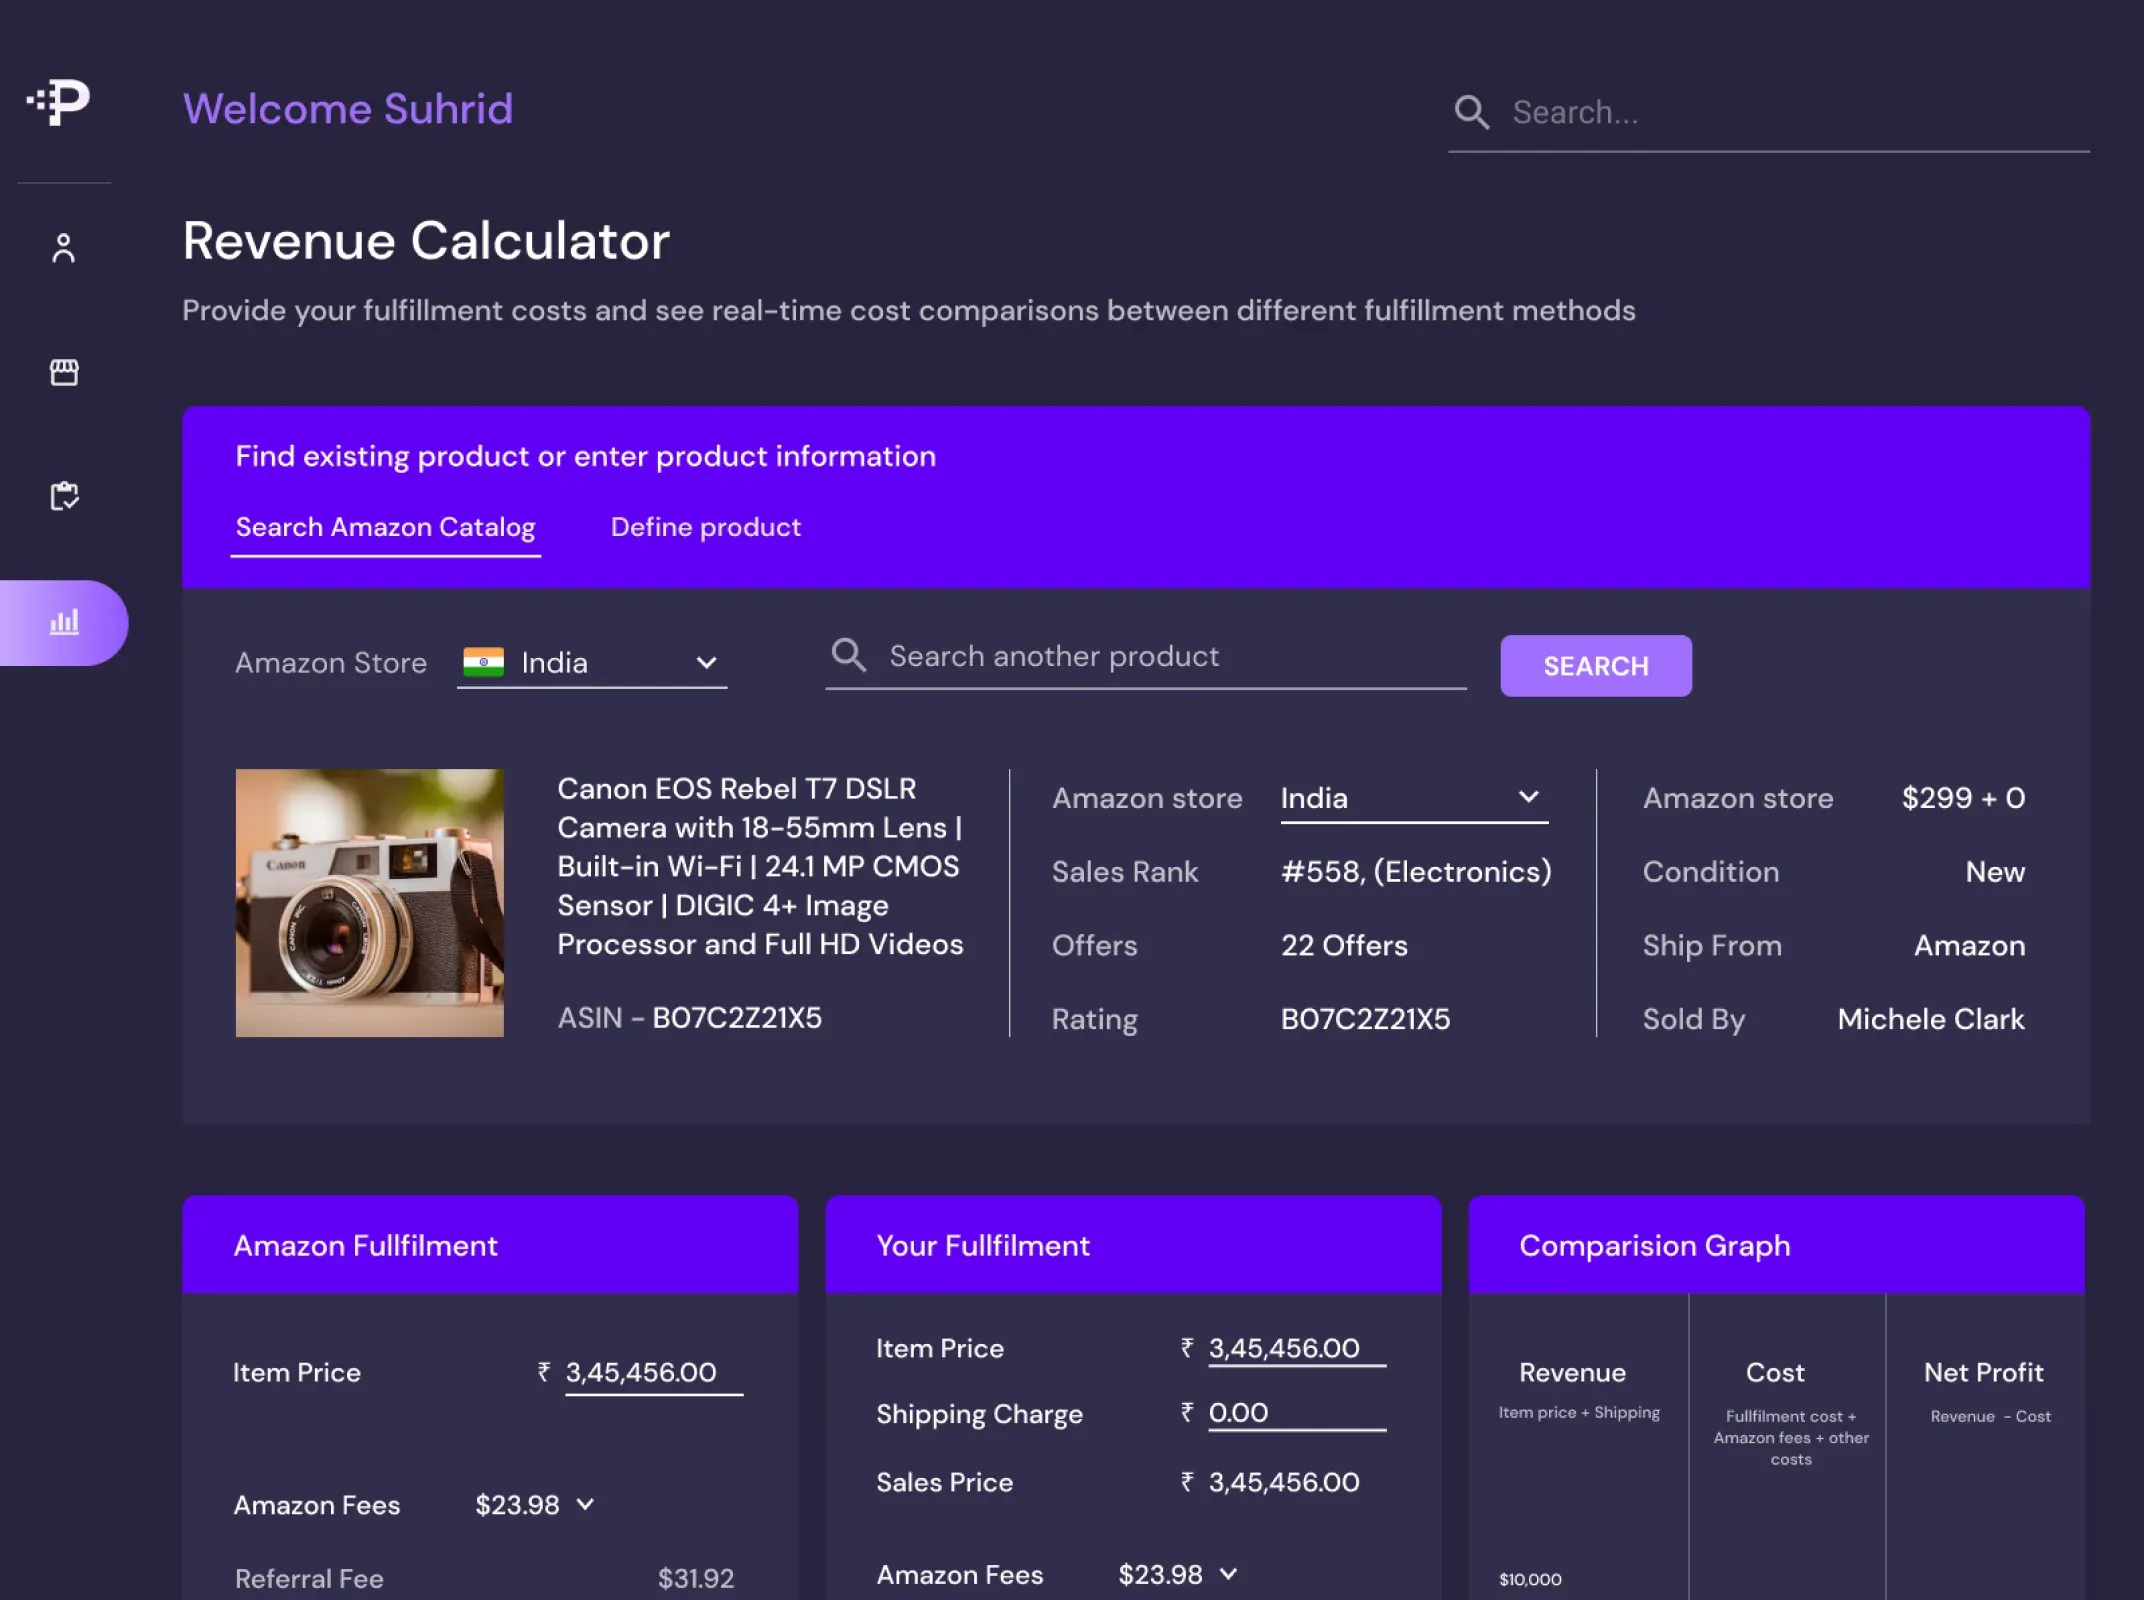
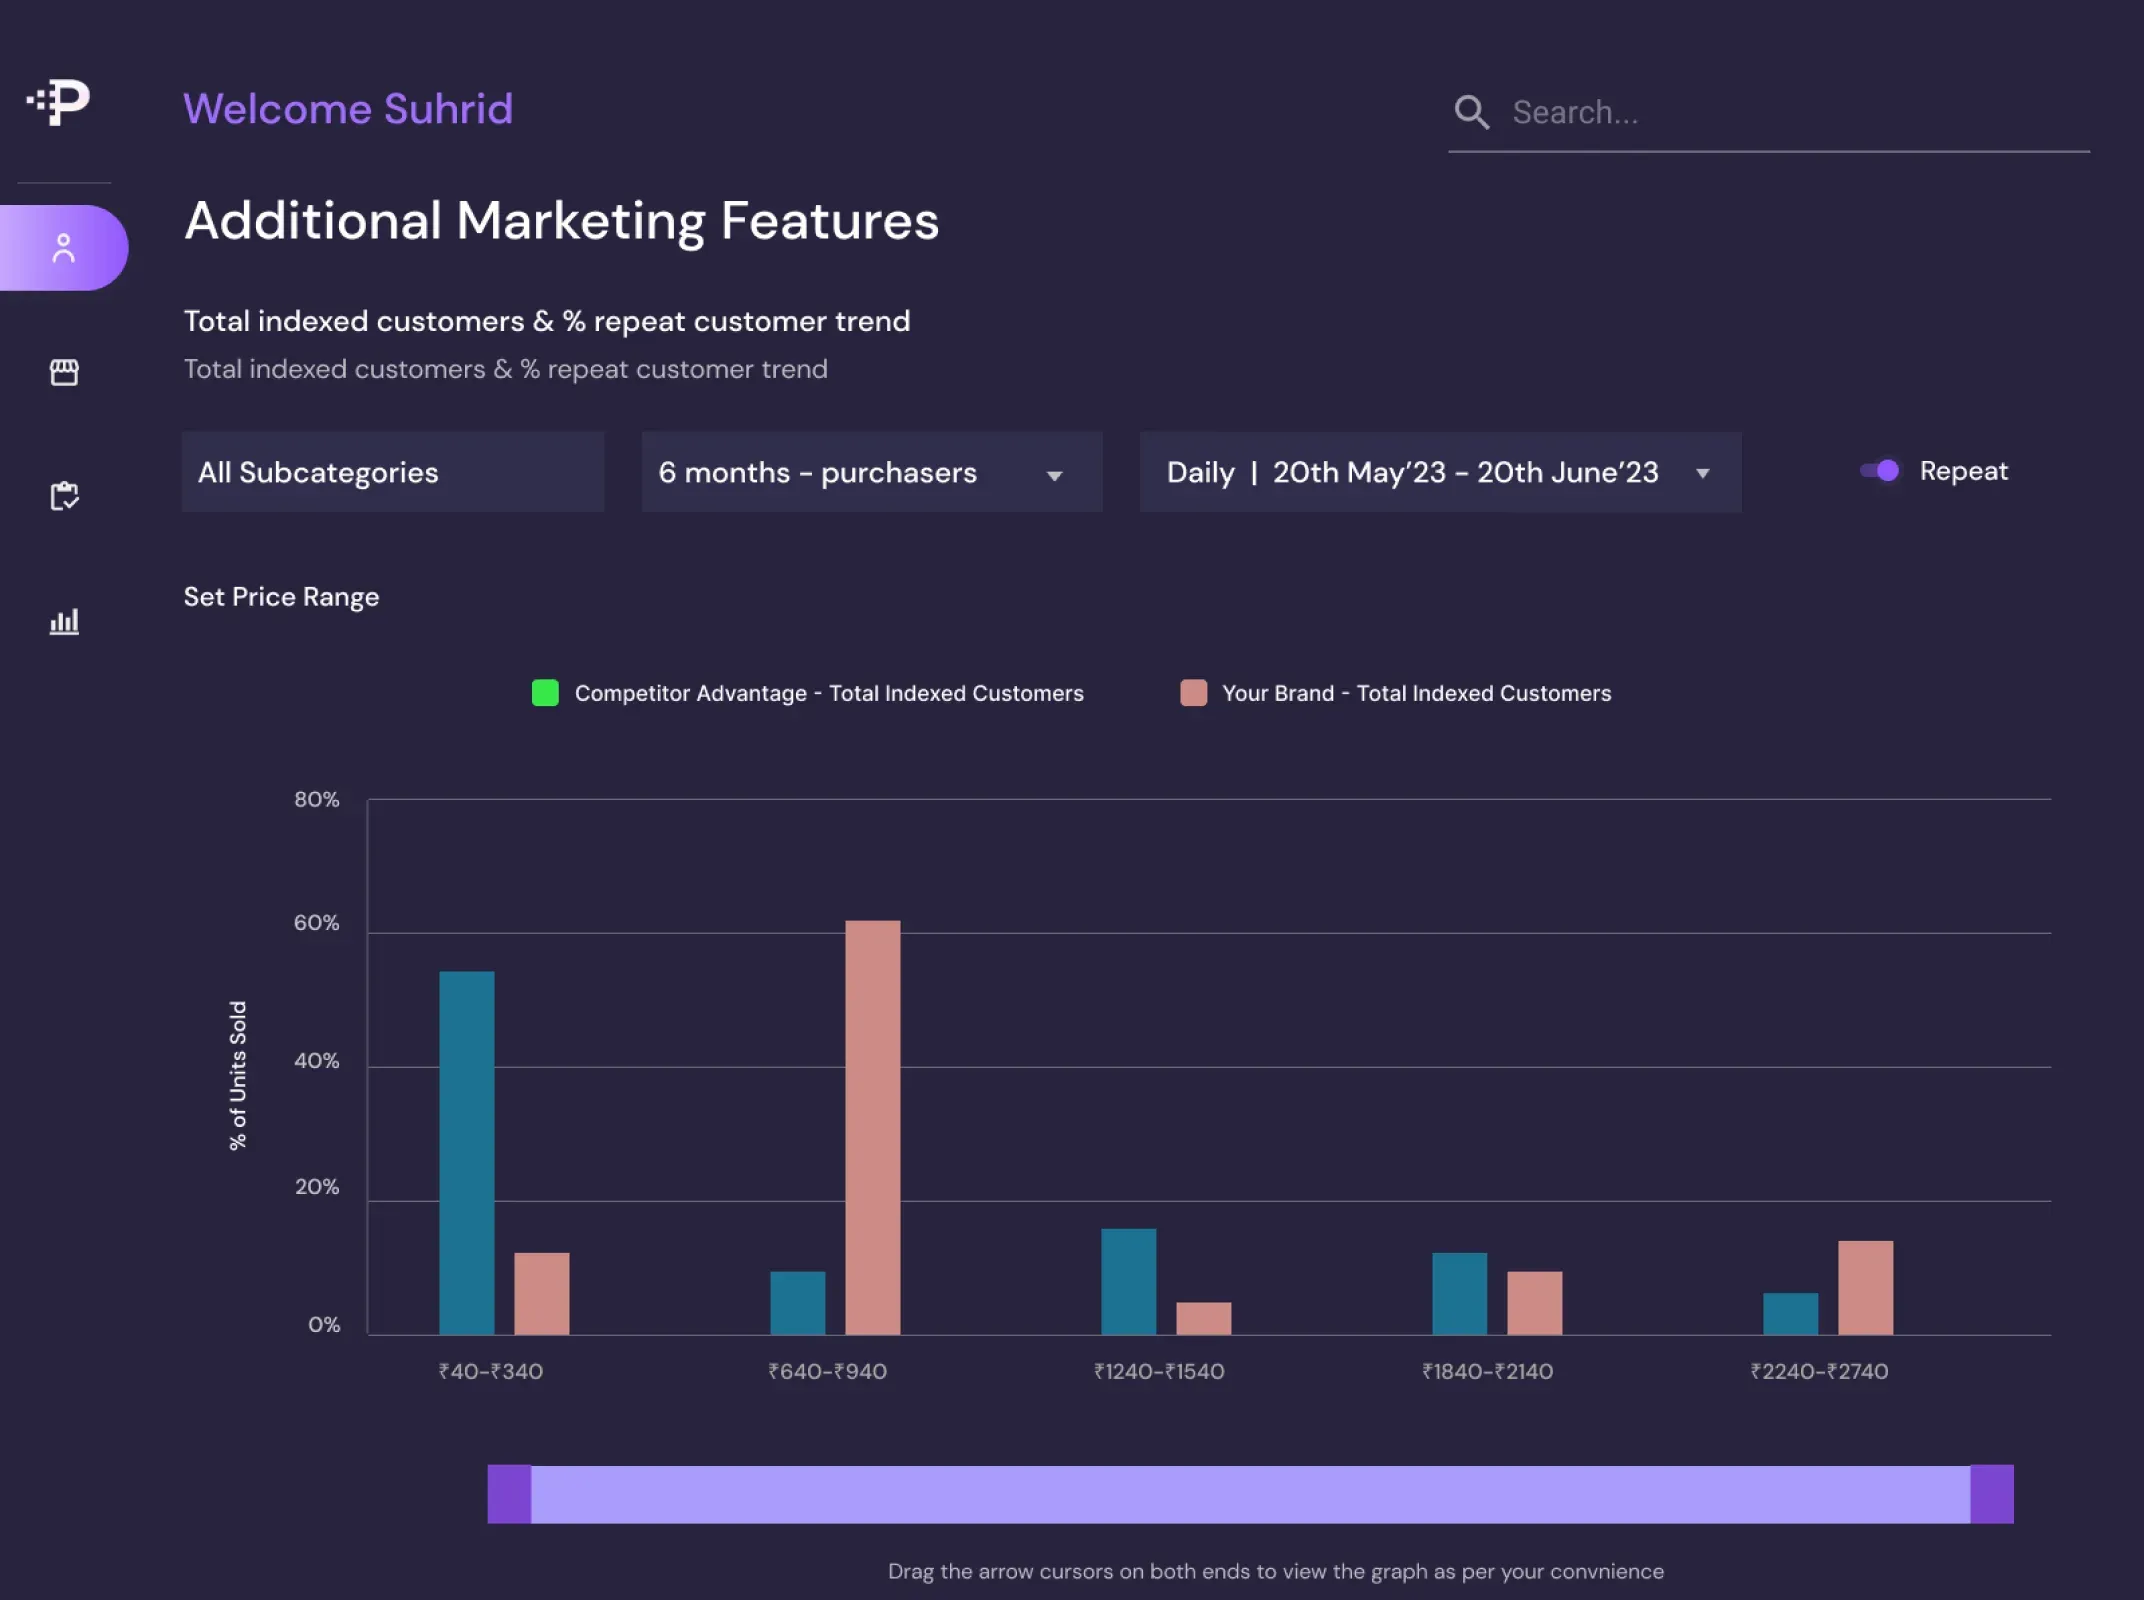
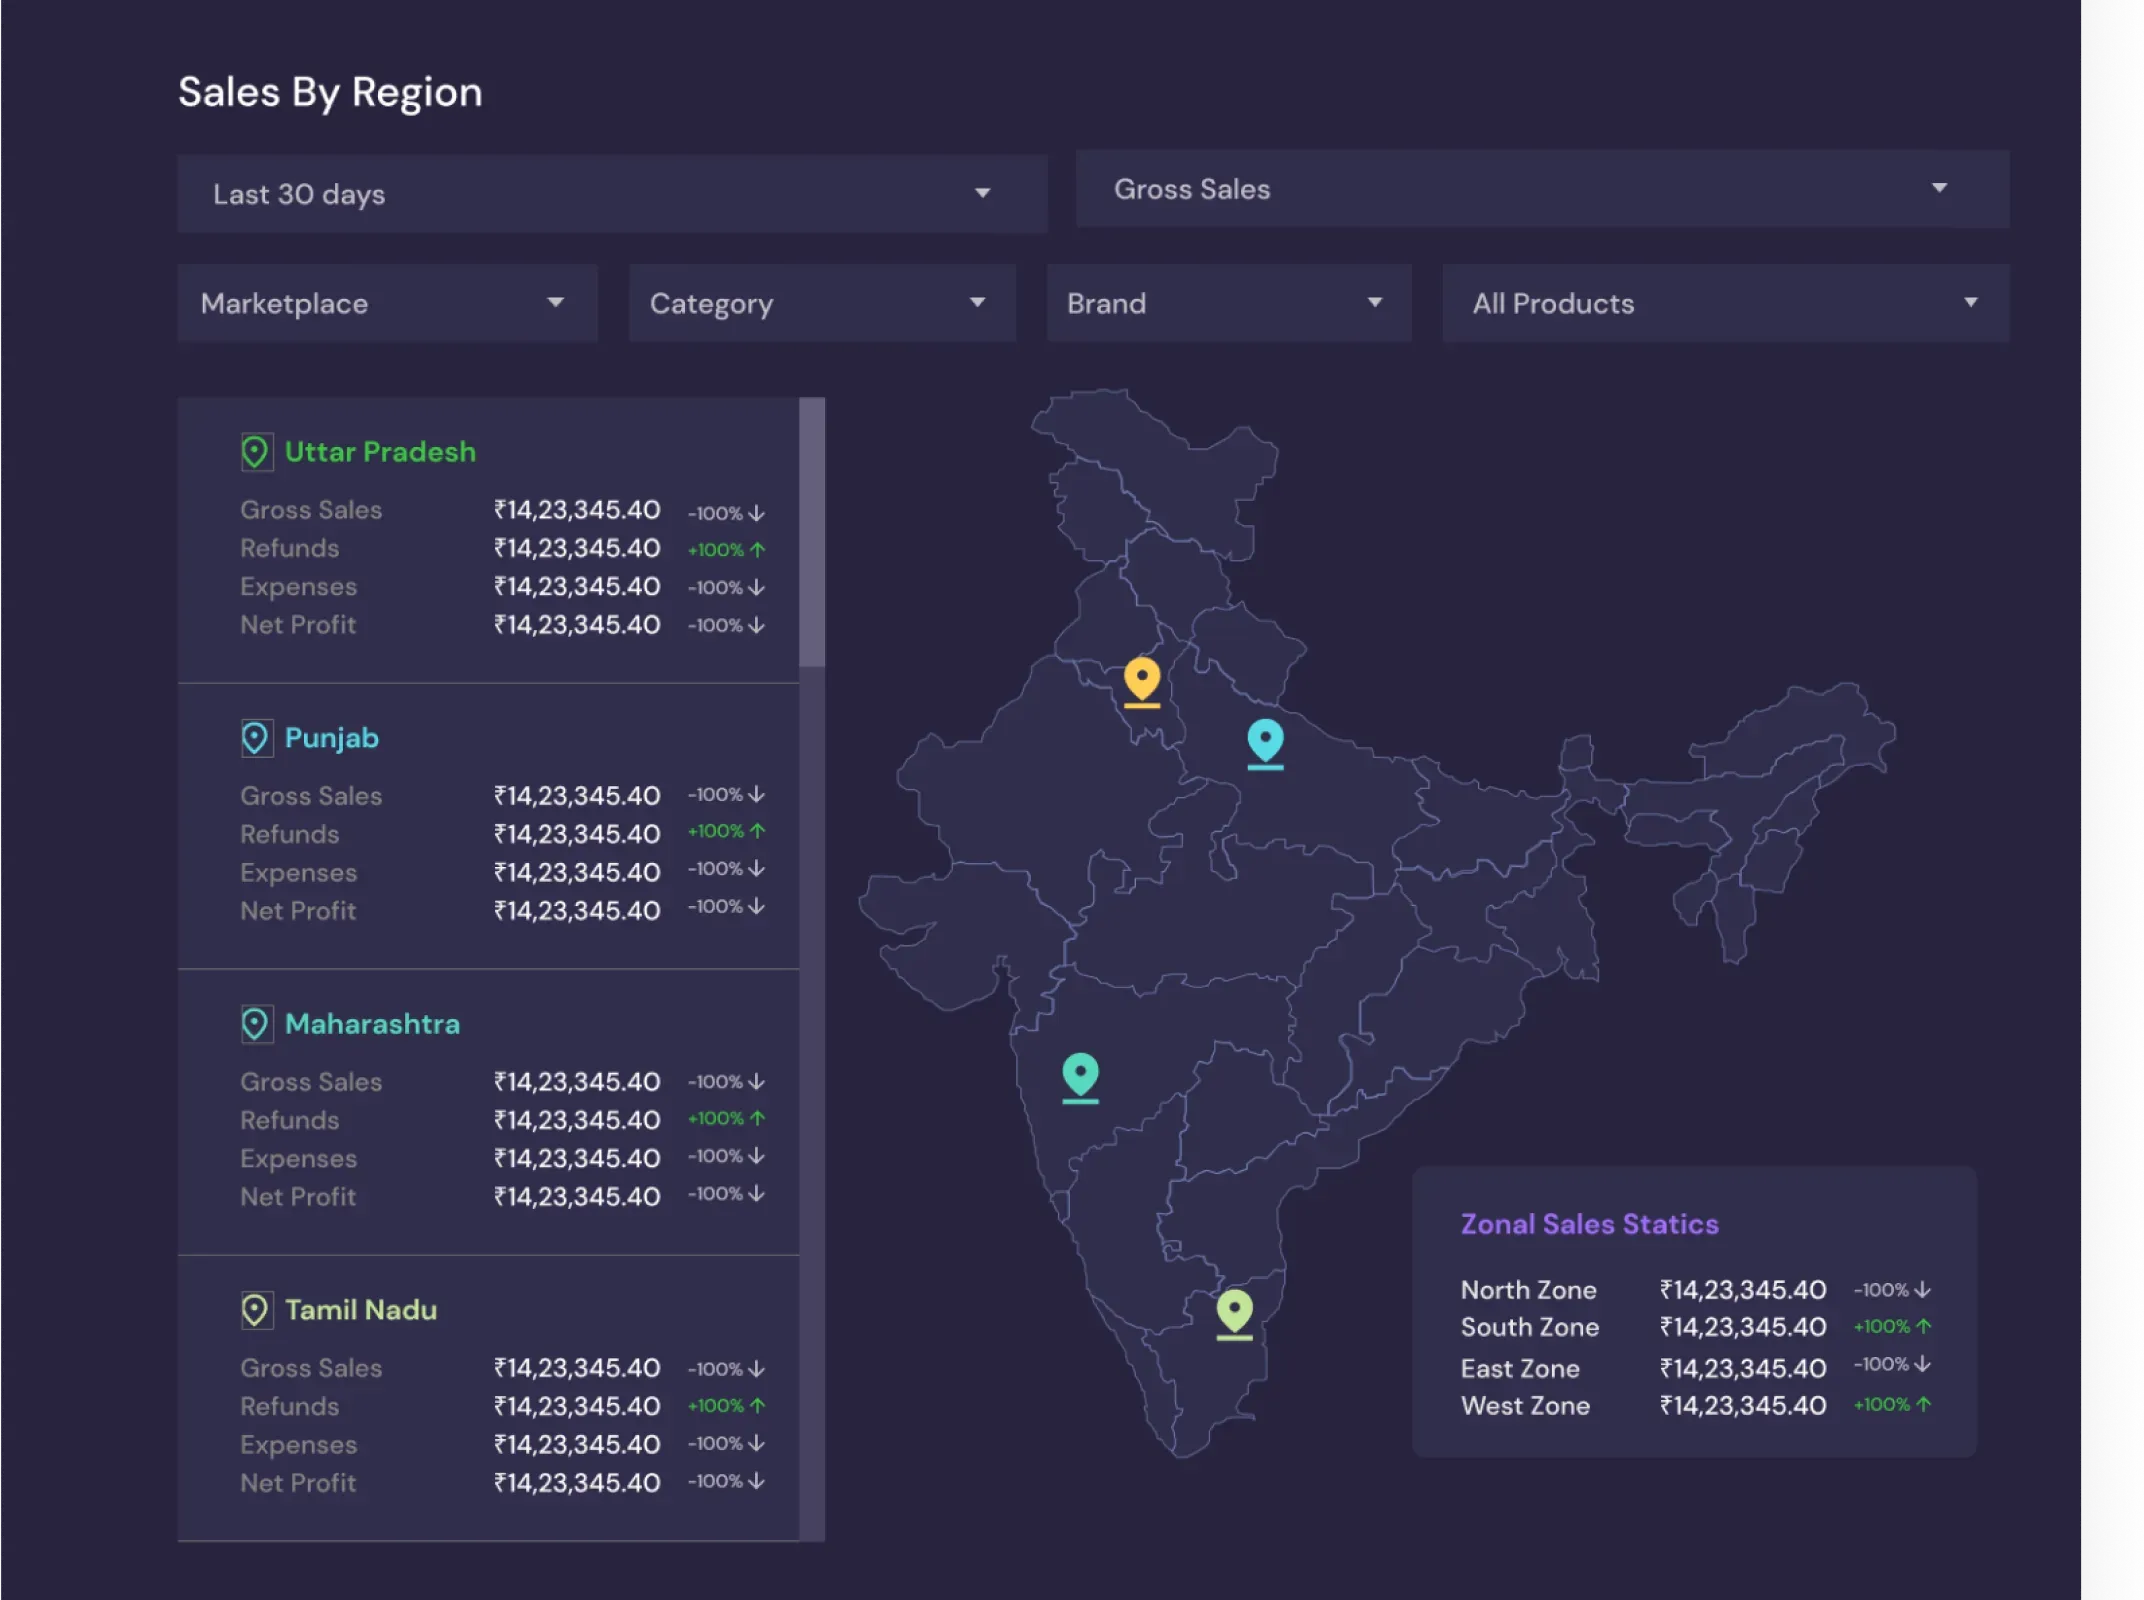
- Developed the React dashboards sellers work in: KPI overviews of sales, units, expenses and net profit, with per-marketplace breakdowns and the charts behind them.
- Built customizable dashboards on top of the platform's automated data sync.
- Implemented role-based access, so each team member sees the data meant for them.
- Integrated the platform's REST APIs into the data views and charts.
Built with
- React.js
- Charts
- REST APIs
- Role-based access
Platform stack
- React
- Node.js
- PostgreSQL
- AWS
- QueryAI
Screens
The dashboards
Building something similar?
Related services:
More case studies
- Ebco.in: a headless storefront and catalog for a furniture-hardware brand
- Highlands Brain: real-time learning tools for a California charter school network
- Cornerstone Ventures: a Webflow site and investor portfolio with automated market data
- Sila Solutions: a bilingual Webflow site for a Gulf biotechnology consultancy
- Innofitt: a WordPress and WooCommerce product catalog for an ergonomics brand